Contents
Example 6: Uncertainty bounds on estimation using first-order variance for PBSIDopt
close all; clear; clc;
The fourth-order LTI model with coloured process noise
% state-space matrices
A = [0.67 0.67 0 0; -0.67 0.67 0 0; 0 0 -0.67 -0.67; 0 0 0.67 -0.67];
B = [0.6598 -0.5256; 1.9698 0.4845; 4.3171 -0.4879; -2.6436 -0.3416];
K = [-0.6968 -0.1474; 0.1722 0.5646; 0.6484 -0.4660; -0.9400 0.1032];
C = [-0.3749 0.0751 -0.5225 0.5830; -0.8977 0.7543 0.1159 0.0982];
D = zeros(2);

% open-loop system
OL = ss(A,[B K],C,[D eye(2)],1);
Open-loop identification experiment
Simulation of the model in open loop
% input signals
N = 4000; % number of samples
t = (0:N-1)';   % time samples
r = randn(N,2); % excitation signal

% noise
e = randn(N,2); % noise signal

% simulation
y0 = lsim(OL,[r zeros(N,2)],t);
y = lsim(OL,[r e],t);
disp('Signal to noise ratio (SNR) (open-loop)')
snr(y,y0)
Signal to noise ratio (SNR) (open-loop)

ans =

   12.1431    7.7604
Identification of the model in open loop
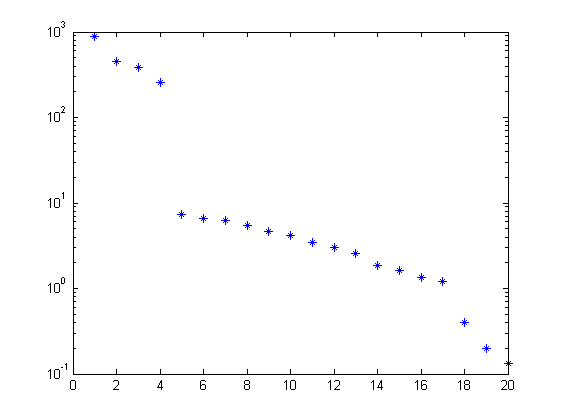
% parameters
n = 4;    % order of system
f = 10;   % future window size
p = 10;   % past window size

% PBSID-varx
[S,X,VARX,U,Zps] = dordvarx(r,y,f,p);
figure, semilogy(S,'*');
x = dmodx(X,n);
[Ai,Bi,Ci,Di,Ki] = dx2abcdk(x,r,y,f,p,'nostable');
VARX identification results
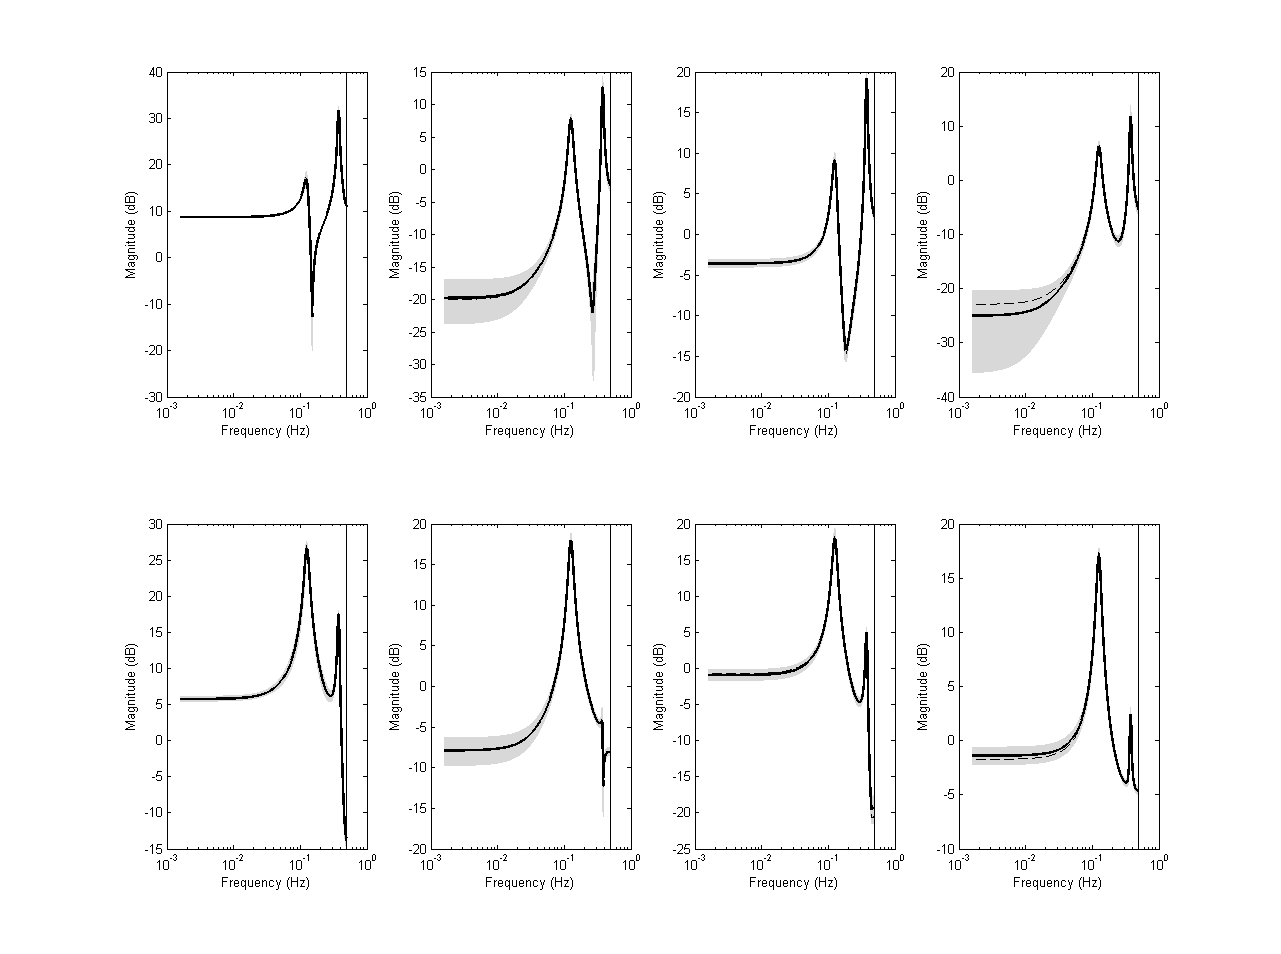
Representing the results in the frequency domain
% Frequency grid
w = logspace(-2,log10(pi),1000);

% Frequency response of identified system
Gr = freqresp(OL(1:2,1:4),w);
[P,sigma] = dvar4varx(r,y,p,VARX,Zps);
[Gi,covG] = dvar2frd(P,w,1,p,VARX);
figure('Units','normalized','Position',[0 0 1 1]),
dbodemagsd(Gi,covG,2.8,w,1,Gr);
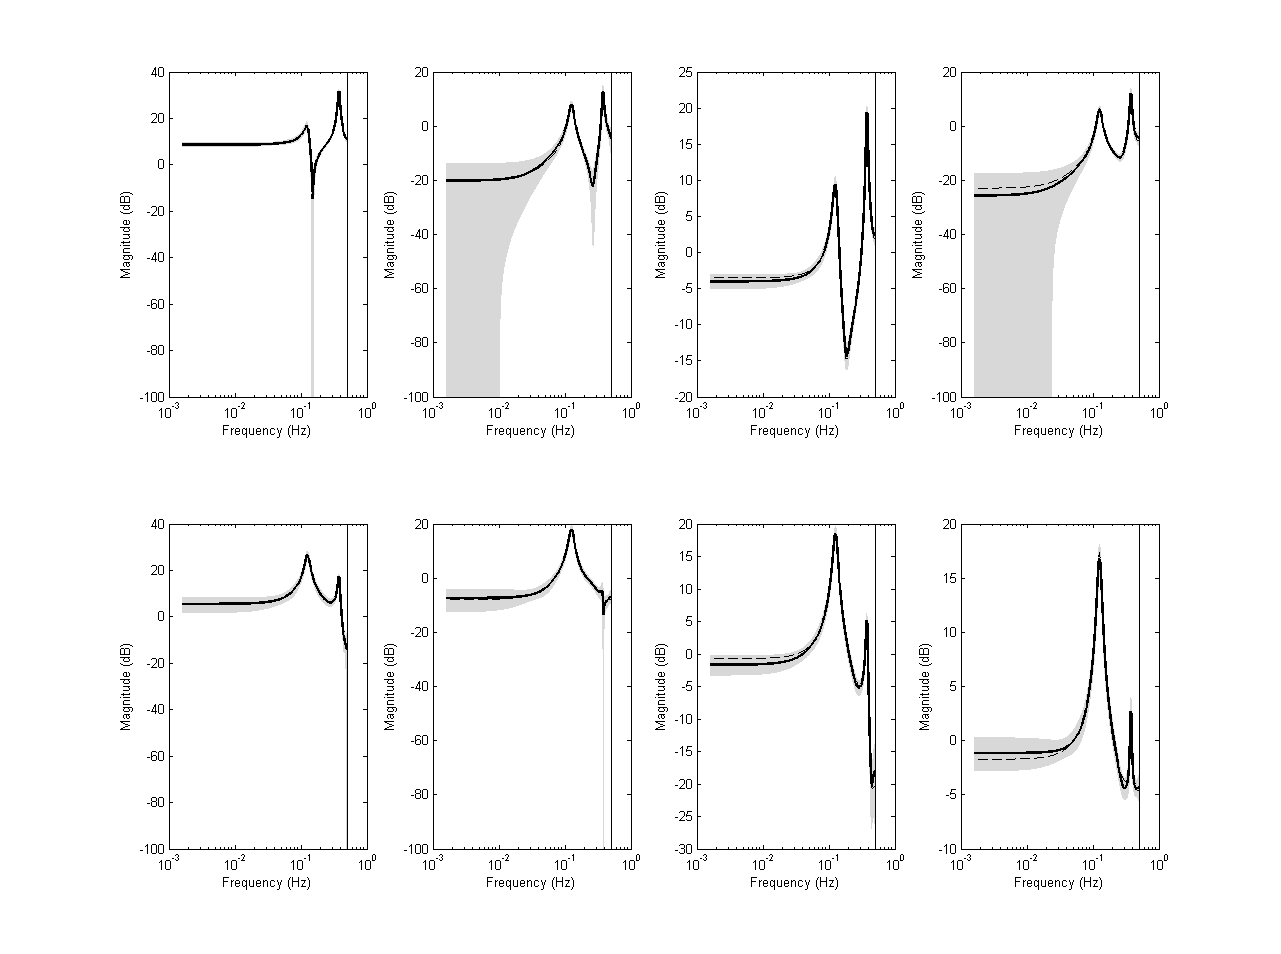
PBSIDopt identification results
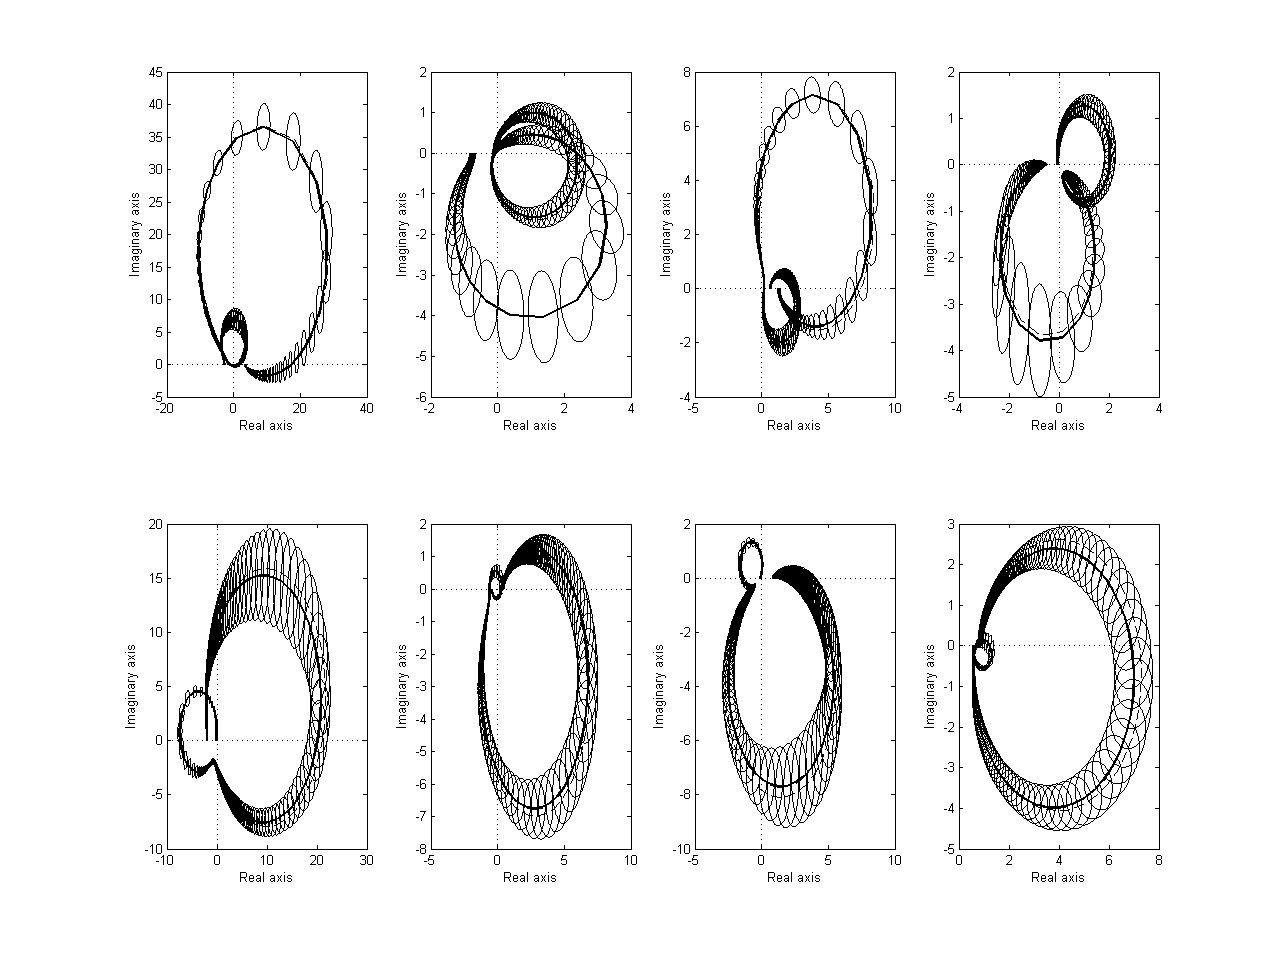
Representing the results in the frequency domain
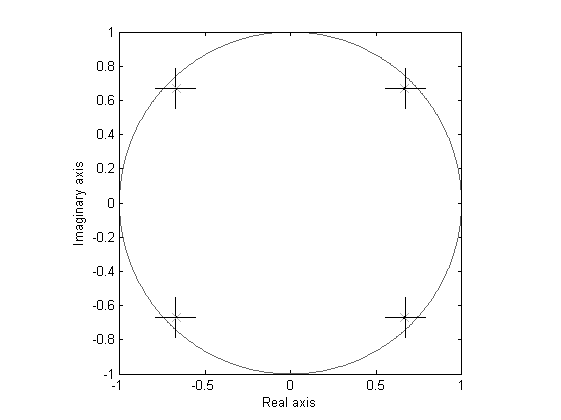
% Frequency response of identified system
Gr = freqresp(OL(1:2,1:4),w);
[P,sigma] = dvar4abcdk(x,r,y,f,p,Ai,Bi,Ci,Di,Ki,U,Zps);
[Gi,covG] = dvar2frd(P,w,1,Ai,Bi,Ci,Di,Ki);
figure('Units','normalized','Position',[0 0 1 1]),
dbodemagsd(Gi,covG,2.8,w,1,Gr);

figure('Units','normalized','Position',[0 0 1 1]),
dnyquistsd(Gi,covG,2.8,Gr);

% Eigenvalues with ellipse bound
[E,covE] = dvar2eig(P,Ai);
figure, deigensd(E,covE,2.8,eig(A));